


Most small recruiting teams assume they need a data scientist to track anything beyond time-to-fill. They don't. After helping dozens of TA teams set up their first real analytics foundation, the pattern is pretty consistent: you can build something genuinely useful in 90 days with spreadsheets and whatever ATS you're already using.
The problem isn't complexity. It's that most analytics advice assumes you have Workday, Tableau, and someone who knows SQL. Small teams need something different — a minimal schema that captures what actually matters, attribution rules simple enough to explain in one sentence, and forecasting models that work in Google Sheets.
Days 1-30: Build your minimal tracking schema
Start with five core fields. Not fifty. Five.
Every requisition needs:
-
Req_ID
Whatever your ATS generates
-
Open_Date
When you actually started sourcing
-
Role_Level
Junior/Mid/Senior/Lead
-
Department
Engineering/Sales/Operations/etc
-
Hiring_Manager
Their actual name
Every candidate interaction needs:
-
Candidate_ID
From your ATS
-
Req_ID
Links to the req
-
Stage
Application/Screen/Interview1/Interview2/Offer/Hired
-
Stage_Date
When they entered that stage
-
Source
Where they came from
That's your foundation. Nothing fancy.
The mistake teams make is trying to track everything at once. One startup had 47 custom fields in their ATS by month two. Recruiters stopped filling them out by week three. Meanwhile, another team with just these basic fields was already spotting bottlenecks. The difference wasn't tooling — it was restraint.
Here's what the first month looks like in practice:
| Week | Task | Output |
|---|---|---|
| 1 | Map current data capture | List of what you're already tracking |
| 2 | Identify gaps in core fields | What's missing from the five essentials |
| 3 | Clean historical data | Backfill last 90 days minimum |
| 4 | Create tracking template | Spreadsheet or ATS config |
The cleaning phase matters more than people expect. You'll find candidates sitting in "phone screen scheduled" for 73 days. Reqs marked filled but still accepting applications. Sources listed as "other" for 60% of your hires. Clean it up now or your analytics will be fiction.
Setting up your tracking template
-
Active_Reqs
Current openings with the five req fields
-
Candidate_Flow
Every candidate movement with the five interaction fields
-
Weekly_Snapshot
Numbers frozen each Friday for trend tracking
Export from your ATS weekly — takes maybe 15 minutes. If you're using AI-powered operational software for recruiting, this export can happen automatically, pulling data directly into your tracking sheets without the Friday scramble.
Don't overthink the structure. A marketing agency with eight recruiters built their entire analytics foundation on this exact template. They went from "we think engineering takes longer to hire" to knowing their frontend roles averaged 31 days while backend averaged 44. That's actionable. That's the whole point.
Days 31-60: Create simple attribution rules
Attribution in recruiting means answering one question: where did this hire actually come from?
Never lose track of top talent again.
Recioly helps you manage every stage of recruiting efficiently, from application to offer.
- Centralized candidate tracking
- Automated interview scheduling
- Collaborative hiring workflows
No credit card required
Most teams make it unnecessarily complicated. Three rules cover it:
First-touch attribution: The original source gets credit
-
Candidate applies through Indeed → Indeed gets credit
-
Even if a recruiter reaches out later
-
Even if an employee refers them afterward
Last-touch attribution: The final action gets credit
-
Started on Indeed, but recruiter sourced them from LinkedIn → LinkedIn gets credit
-
Use this for understanding what actually converts
Assisted attribution: Track both, assign a 70/30 split
-
70% to last touch (what closed them)
-
30% to first touch (what introduced them)
Pick one. Stick with it for at least six months.
A healthcare staffing firm switched attribution methods three times in four months. Their LinkedIn numbers went from "best source" to "worst source" to "somewhere in the middle" purely based on which model they were using at the time. The CEO thought recruiting was gaming the numbers. They weren't — the measurement kept changing.
Building your attribution tracking
Add these fields to your candidate flow:
-
First_Source
Where they originally came from
-
Last_Source
What triggered the application
-
Source_Detail
LinkedIn/message, Indeed/sponsored, Referral/engineering
Track source detail because "LinkedIn" isn't specific enough. LinkedIn organic search performs differently than InMail, which performs differently than job posts. You need that granularity to make real budget decisions.
Standardize source naming early (e.g., LinkedIn/InMail vs LinkedIn/post) to avoid fragmented categories.
You'll probably discover that your best source isn't what you think. One SaaS company was spending $3k a month on AngelList Prime. Attribution showed zero hires from it in six months. But they had around 12 hires from free LinkedIn posts their engineers were sharing. They reallocated the budget and doubled engineering hires.
Days 61-90: Build three forecasting models
Forget complex predictive analytics for now. You need three simple models that work in spreadsheets.
Model 1: Funnel velocity forecasting
Calculate how long each stage takes on average:
-
Application → Phone Screen
X days
-
Phone Screen → First Interview
Y days
-
First Interview → Final Interview
Z days
-
Final Interview → Offer
A days
-
Offer → Accept
B days
Add them up. That's your baseline velocity. Now you can actually forecast: if you need 5 hires by March 1st and your velocity is 35 days, you need 5 offers out by January 25th. Working backward with your conversion rates tells you how many applications you need today.
An operations software company used this to spot that their February hiring was going to miss by roughly 40%. They surged sourcing in January and hit their target. Without the model, they would've discovered the miss in March when it was already too late.
Model 2: Capacity-based forecasting
Each recruiter can handle a realistic number of concurrent reqs, phone screens per week, and interviews to coordinate. Map current load against capacity:
| Recruiter | Current Reqs | Max Reqs | Screen Capacity | Current Screens |
|---|---|---|---|---|
| Jamie | 8 | 6 | 15/week | 18/week |
| Alex | 4 | 6 | 15/week | 12/week |
| Sam | 7 | 6 | 15/week | 16/week |
Jamie and Sam are over capacity. Their reqs will slow down. Either redistribute or reset hiring expectations with leadership.
This model saved a fintech startup from a rough Q4. They could see in August that their September hiring push would overwhelm their two-person team by October. They brought in a contract recruiter for 90 days, stayed on track, and avoided the scramble most companies only notice once they're already inside it.
Model 3: Source mix forecasting
Track conversion rates by source:
-
LinkedIn
2% application to hire
-
Referrals
8% application to hire
-
Indeed
0.5% application to hire
If you need 10 hires:
-
Only LinkedIn
need 500 applications
-
Only referrals
need 125 applications
-
Only Indeed
need 2,000 applications
Obviously you'll use multiple sources, but this shows where to focus. More importantly, it shows when you're too dependent on one channel. If 80% of your hires come from referrals and referrals start drying up, you can see the problem months before it hits.
The three models together form a simple but functional forecasting process:
[Funnel Velocity Model] → [Capacity Check] → [Source Mix Allocation] → Hiring Plan
Run this workflow monthly to surface issues early.
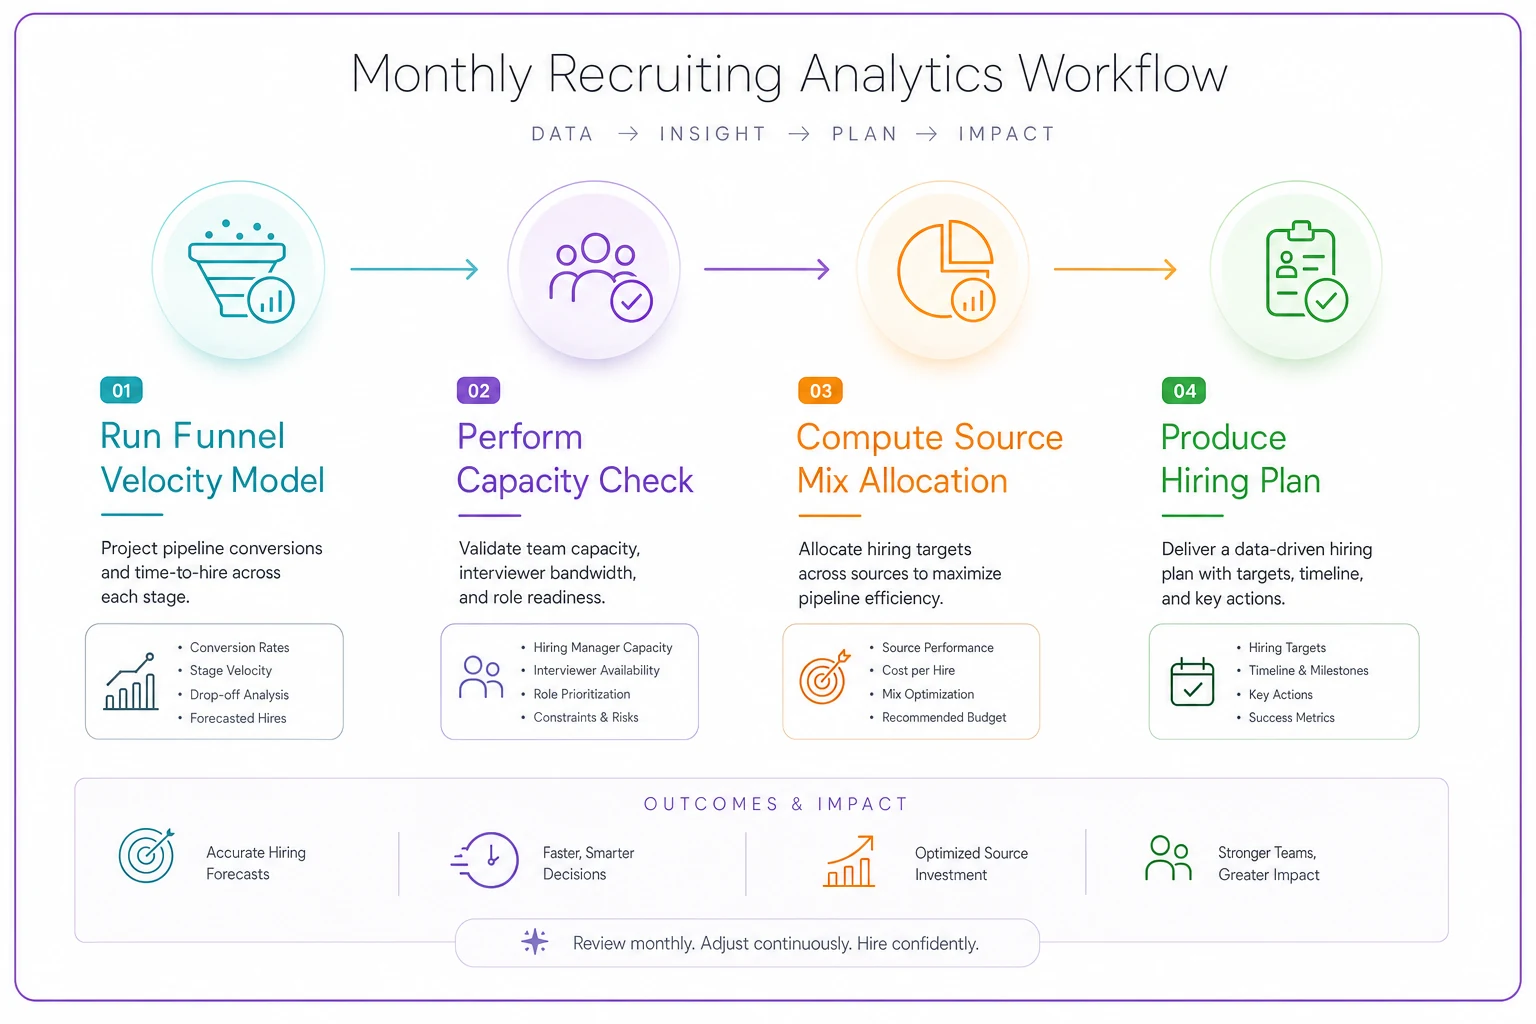
Run them together each month and you'll catch problems before they become emergencies.
The weekly rhythm that makes this work
Every Friday afternoon, spend about 45 minutes:
-
Export fresh data from your ATS
-
Update your three tracking sheets
-
Calculate your key metrics
-
Note what changed from last week
-
Send a one-paragraph update to leadership
The update matters. Not a dashboard — a paragraph. "This week we saw phone screen conversion drop to 38% from our usual 45%. All five rejections came from the senior backend role. The JD might be scaring off good candidates. Recommending we revisit requirements with the hiring manager."
That paragraph does more for recruiting credibility than any dashboard ever will.
When things break (and they will)
Around day 45, something in your data will break. Someone forgets to update stages. Your ATS eats a batch of candidates. A hiring manager runs their own process outside the system.
This is normal. Plan for it.
Run a quick weekly data quality check:
-
Any candidate stuck in a stage over 14 days?
-
Any req showing zero activity for a week?
-
Any source showing zero applications suddenly?
-
Any conversion rate that moved more than 20% week-to-week?
When you find issues, fix the data and fix the process. A retail company discovered their store managers were conducting informal coffee chats before official interviews. These weren't tracked anywhere, so their interview-to-offer conversion looked terrible — 22% — when it was actually 61% once you counted the coffee chats as a real screening stage.
The infrastructure question
By day 60, someone will ask about "proper BI tools" or "a real data warehouse." Resist. You're not there yet.
What you built in 90 days will serve you fine until you're hiring 50+ people per quarter. Even then, the schema you designed, the attribution rules you chose, and the models you built will transfer directly into whatever system comes next.
If you're already using AI-powered recruiting operations software, a lot of this often comes built-in. The software tracks your schema automatically, applies attribution rules consistently, and runs forecasting without the manual Friday exports. But even with automation in place, understanding these foundations means you know what the numbers actually mean — and when they're lying to you.
Making decisions with minimal analytics
The point isn't perfect data. It's making better decisions than you're making now.
A minimal analytics setup will tell you:
-
Which sources actually deliver hires, not just applications
-
Where candidates are getting stuck in your process
-
When you're about to miss a hiring target
-
Which recruiters are overwhelmed
-
Whether your process is getting faster or slower over time
A three-person recruiting team at a logistics company built exactly this system. In 90 days they discovered their expensive recruiting firm had delivered around 300 candidates and zero hires, their phone screen pass rate was 70% — way too high, meaning they weren't screening hard enough — their average role took 47 days to fill but Sales roles took 62, and they needed to start recruiting for Q1 roles in November, not January.
Beyond day 90
Once your foundation is stable, you can layer in more:
-
Quality of hire metrics (performance ratings at 6 months)
-
Recruiter effectiveness scores that go beyond activity
-
Predictive indicators (which interview scores actually correlate with performance)
-
True cost per hire by source and role
But don't rush to add these. Most recruiting teams operate for years without solid basics — tracking quality-of-hire while their application-to-phone-screen conversion sits at 3% and nobody's noticed.
Build the foundation. Use it for two quarters. Then expand.
The recruiting teams that succeed with analytics aren't the ones with the fanciest tools. They're the ones who picked a simple system and stuck with it — updating data every week, making decisions based on numbers instead of gut feelings, answering "how long does it take to hire an engineer?" with an actual number instead of "it depends." Your recruitment analytics foundation doesn't need to be complex. It just needs to exist, and these 90 days give you exactly that.
Ready to elevate your hiring process?
Join 1,500+ recruiting teams using Recioly to save time, improve collaboration, and hire smarter.