


Most recruiting budgets get built backwards. Someone asks TA "how many recruiters do you need next year," a number gets pulled from last year's headcount plus a fudge factor, and finance either approves it or cuts it by 15% to feel responsible. Nobody in that conversation can trace the number back to actual throughput. When hiring targets slip six months later, nobody can say whether the problem was the budget, the pipeline, or the plan.
The fix isn't a better guess. It's a model that connects capacity, throughput, cost, and risk in a way both TA leaders and finance can actually defend line by line. That's what TA capacity-backed budgeting means — you start from what a recruiter can realistically produce, work up to what the org needs to hire, and only then translate that into dollars, vendors, and scenarios. Built in that order, the budget stops being a negotiation and starts being a calculation.
This is the workbook version. Formulas, line-items, stress tests, payback math, and the slides you'll need to get sign-off. It assumes you already know your funnel and your operating model — if you're still mapping demand to capacity at the foundational level, the workforce-planning hiring architecture is the prerequisite. This picks up where that leaves off and takes it into the finance conversation.
Why the standard TA budget conversation falls apart
Finance and TA are speaking two different languages, and the budget is where the translation breaks down.
Finance thinks in cost per unit, marginal spend, and payback. TA thinks in reqs, pipeline health, and time-to-fill. When TA asks for two more recruiters, finance hears "$300k of fixed cost with no clear return." When finance cuts one of those roles, TA hears "you don't care if we miss the hiring plan." Both are right, and both are working from numbers that were never reconciled.
The deeper problem is that recruiter cost isn't actually the expensive part. In most orgs, fully-loaded recruiter salary is only 40–55% of the true cost of hiring. The rest is spread across tools, agencies, job boards, assessment platforms, background checks, referral bonuses, and the enormous hidden cost of roles that stay open too long. A budget built only on headcount ignores more than half the actual spend — and that missing half is exactly where finance's skepticism lives.
So the first move isn't to argue for more recruiters. It's to build a model that shows the full cost of hiring, ties it to output, and makes the tradeoffs visible. Once the numbers are traceable, the conversation shifts from "trust me" to "here's the math, which lever do you want to pull."
Start with capacity-to-throughput, not headcount
Headcount is an input. Throughput is what finance is actually buying. The whole model rests on translating one into the other, and getting this formula honest matters more than getting it precise.
Never lose track of top talent again.
Recioly helps you manage every stage of recruiting efficiently, from application to offer.
- Centralized candidate tracking
- Automated interview scheduling
- Collaborative hiring workflows
No credit card required
The core chain: Effective recruiter hours → active reqs → offers → hires.
Break it down:
-
Available capacity. Start with a recruiter's working hours, then subtract everything that isn't req work — admin, meetings, training, PTO, system time. In practice, a full-time recruiter has roughly 28–32 productive hours a week, not 40. Budgets that assume 40 are already 20–25% overstated on day one.
-
Req load. Divide productive hours by the hours a req consumes per week. This varies a lot by role complexity. A high-volume operations req might cost 2-3 hours/week to keep moving; a senior engineering or executive search can eat 8-12. This is why "reqs per recruiter" as a flat number is meaningless — a recruiter carrying 8 warehouse roles and a recruiter carrying 8 staff engineer roles are not doing the same job.
-
Throughput conversion. Apply your funnel. If your req-to-offer rate and offer-accept rate hold, a given active req load produces a predictable number of hires per quarter. This is where your funnel data does the heavy lifting — and where most models quietly cheat by assuming best-case conversion.
A worked version looks like this:
| Input | Volume role | Technical role |
|---|---|---|
| Productive hours/week | 30 | 30 |
| Hours per req/week | 2.5 | 9 |
| Concurrent active reqs | 12 | ~3.3 |
| Avg time-to-fill (weeks) | 5 | 11 |
| Hires per recruiter/quarter | ~9–11 | ~3–4 |
The two columns produce output that differs by nearly 3x. If your budget uses a blended "recruiter produces X hires" number, you're structurally mis-funding one of those role families. The model has to be built by role family, then rolled up — never rolled up first.
One pattern worth flagging: throughput isn't linear with req load. Pile too many reqs on a recruiter and per-req conversion drops, because context-switching and slow candidate response tank the funnel. Past a certain load, adding reqs actively reduces total hires. Your model should include a capacity ceiling, not just a multiplier.
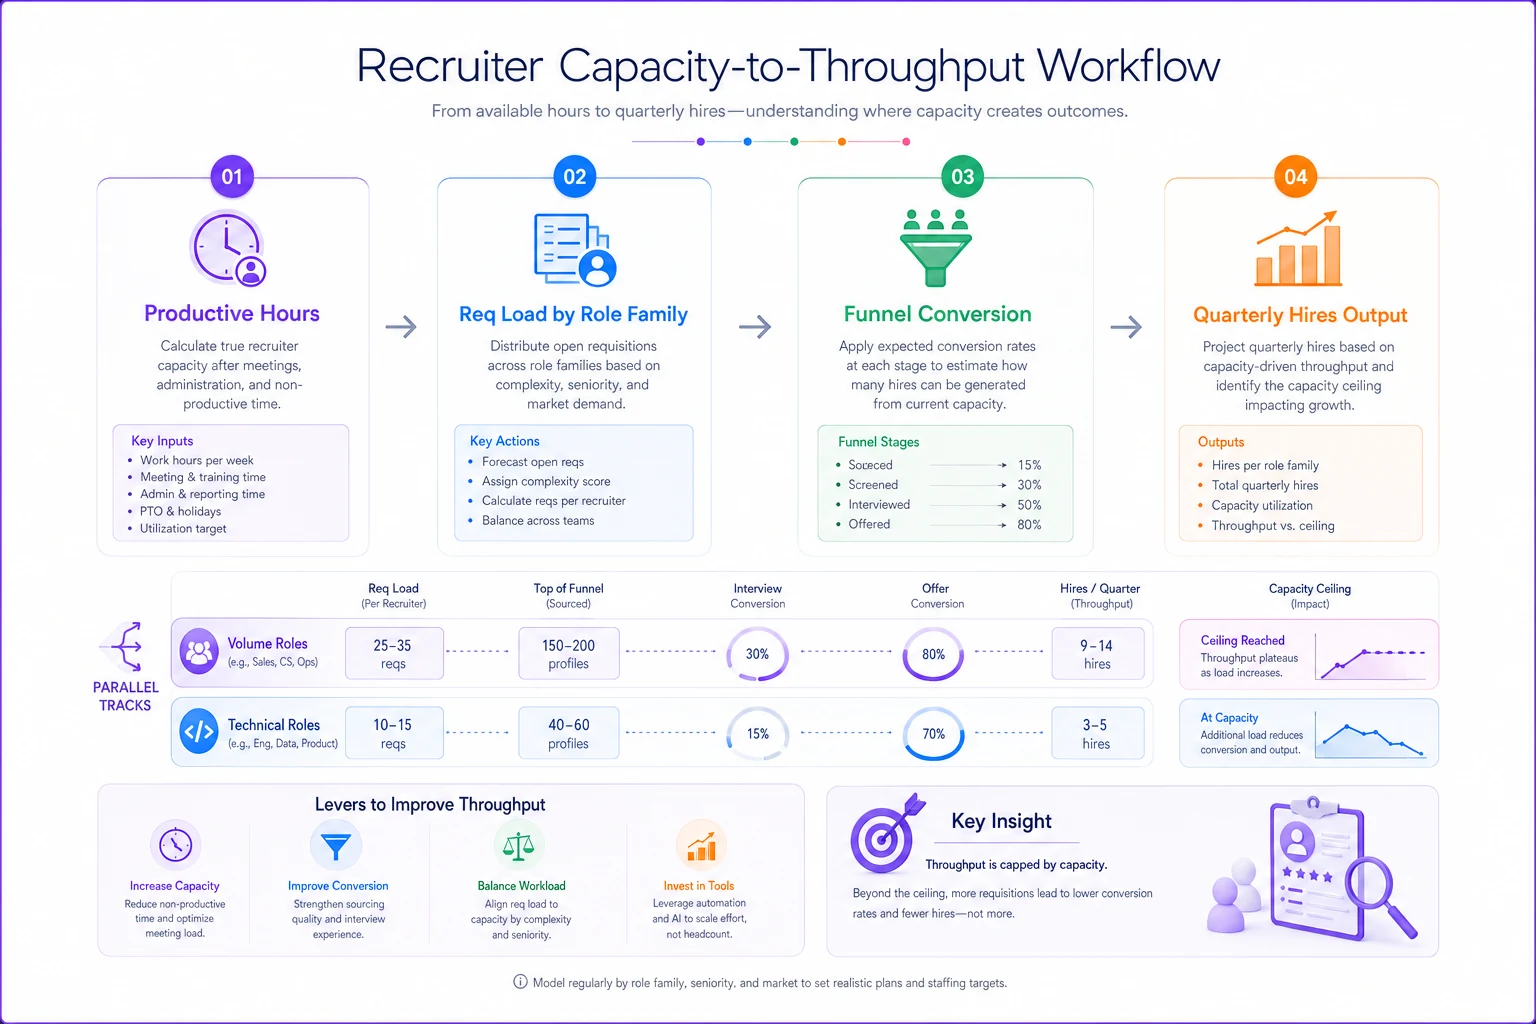
This visual maps the flow from productive hours through req load and funnel conversion to quarterly hires.
Building the vendor and tooling TCO
Once throughput math tells you how many recruiters you need for the hiring plan, you layer on everything else it costs to run them. This is the part finance respects and TA usually underbuilds.
Total cost of ownership for a recruiting function isn't a single number — it's a stack of line-items, each with its own cost driver. Group them so nothing hides:
-
People costs. Fully-loaded recruiter comp (salary + benefits + tax + equity), coordinator and sourcer comp, and management overhead. Load factor is usually 1.25–1.4x base.
-
Core platform. ATS/CRM license, per-seat or per-hire. Watch for pricing that jumps at usage tiers.
-
Sourcing and data. LinkedIn Recruiter seats, contact-data tools, job board slots, programmatic ad spend. This is where spend creeps quietly — teams add seats and never remove them.
-
Assessment and screening. Coding platforms, skills tests, background checks, reference tooling — often priced per candidate, which means cost scales with pipeline volume, not hires.
-
Agencies and RPO. Contingent fees (typically 18–25% of first-year comp) and any retained or RPO commitments. This line is volatile and deserves its own scenario treatment.
-
Referral program. Bonuses paid, plus the admin to run it.
-
Hidden operational cost. Cost of vacancy — the productivity or revenue lost per day a role sits open. Most ignored, often the largest line.
That last one changes the entire conversation. If a critical role generates or protects roughly $1,200/day in value and takes 20 days longer to fill than it should, that's $24k of cost per hire that never shows up in any tool invoice. Model it, and suddenly a $15k/year sourcing tool that shaves a week off time-to-fill isn't an expense — it's the cheapest thing on the page.
A useful discipline: express every vendor line-item on a per-hire basis alongside its raw annual cost. Raw cost tells you the check you write. Per-hire cost tells you whether it's earning its place. A tool costing $40k/year against 400 hires is $100/hire; the same tool against 60 hires is $667/hire. Same invoice, completely different decision.
Scenario stress tests: because the plan will change
A single-scenario budget is a fiction. Hiring demand moves with the business, and the whole point of building the model properly is that you can flex it fast when the plan shifts.
Base case. The approved hiring plan at expected funnel conversion. This is your headline budget.
Downside / hiring freeze. Demand drops 30–50%. The stress test here isn't "spend less" — it's "how much cost is actually variable?" Fixed recruiter comp doesn't flex quarter to quarter, but agency spend, contract sourcers, and per-candidate tooling do. A healthy cost structure can shed a meaningful chunk of spend without layoffs. If almost all your cost is fixed headcount, that's a finding — it means you have no shock absorber.
Upside / demand spike. Hiring plan jumps 40%. Can existing capacity absorb it, or do you hit the throughput ceiling? This is where the model earns respect — you can show exactly at what hire volume the current team breaks, and whether the marginal capacity should come from a new recruiter (fixed) or agency spend (variable but pricier per hire).
The stress test that matters most is a conversion shock. Hold hiring targets constant but degrade funnel conversion by 15–20% — a tougher market, slower offer accepts, a bad quarter. Watch what it does to required capacity and cost. In most models this is scarier than a demand spike, because worse conversion means every hire needs more pipeline, more recruiter hours, and more tooling volume to produce the same result. Teams that only stress-test volume get blindsided by conversion.
When you run these, keep the sourcing cost structure honest across scenarios — channel mix and cost-per-hire shift as you scale volume up or down. If you haven't modeled sourcing as an investment with variable returns by channel, the strategic sourcing framework gives you the channel-mix and ROI logic that plugs directly into these scenarios.
Payback and sensitivity: making the money argument
Finance ultimately wants two answers: what do we get back, and how sure are we.
Payback on capacity investment
For any incremental recruiter or tool, the payback logic is: Investment ÷ (value created per period − cost per period) = periods to payback.
The value created is where you use cost-of-vacancy again. If adding a recruiter lets you fill 12 more critical roles a year, each costing $24k in vacancy time, that's roughly $288k in avoided cost against a ~$140k fully-loaded recruiter. On paper the payback is well under a year. The honest version discounts that: not every role is critical, not all avoided vacancy translates to real dollars, and ramp time means a new recruiter isn't productive for the first 8–12 weeks. Build the ramp curve in — a recruiter hired in Q1 contributes maybe 60% of a full year's output in year one.
For tools, payback is cleaner: annual cost against measurable time-to-fill reduction or recruiter-hours saved, converted to vacancy cost or capacity freed.
Sensitivity analysis
This is the part that tends to win finance over, because it shows you know your own numbers aren't certain. Take your two or three most important assumptions — usually funnel conversion, cost of vacancy, and recruiter ramp time — and show how the budget and payback move when each shifts ±20%.
A simple sensitivity table beats a confident single number every time:
| Assumption | −20% | Base | +20% |
|---|---|---|---|
| Offer-accept rate | Budget +$180k | Budget | Budget −$140k |
| Cost of vacancy | Payback 14 mo | Payback 9 mo | Payback 6 mo |
| Recruiter ramp time | Payback 11 mo | Payback 9 mo | Payback 8 mo |
The point isn't precision. It's showing finance which assumption the whole budget hangs on — usually conversion rate — so the conversation focuses on the one number that actually matters instead of arguing about tool line-items that barely move the total.
The executive justification pack
You've done the work. Now it has to survive a 30-minute meeting with people who won't read the model. Good analysis dies here more often than people admit.
Two deliverables, and only two:
The one-page summary. Everything a busy exec needs, on a single page:
-
Hiring plan (roles, by family, by quarter)
-
Total requested budget and last year's actual, side by side
-
Cost per hire, base case, with the trend
-
The three scenarios in one small table with the cost of each
-
The single biggest risk and the one number the budget is most sensitive to
-
The ask, stated plainly
The slide pack (5–7 slides max).
-
The hiring plan and what it maps to in headcount
-
Capacity-to-throughput math, one clean visual
-
The full TCO stack — where the money actually goes
-
Three scenarios and what flexes in each
-
Payback and sensitivity
-
The ask and the decision needed
The mistake almost everyone makes is leading with the ask. Lead with the throughput math. When finance sees that the number came from a formula tied to the hiring plan — not from TA wanting more people — the rest of the conversation becomes about tuning inputs, not defending existence. That shift in framing is worth more than any single line-item you'll argue over.
A real scenario: a 220-person company scaling to 400
A B2B software company planned to grow from roughly 220 to 400 people over four quarters — about 190 hires including backfills, split across engineering, sales, and G&A. TA had two recruiters and asked for four more. Finance's opening position was "approve one, revisit at midyear."
The old ask had no throughput backing. Rebuilt as a capacity-backed model, the picture changed. Engineering reqs (9 hrs/req, ~11-week fill) and volume sales reqs (2.5 hrs/req, ~5-week fill) were modeled separately. The math showed the plan actually needed roughly 4.5 recruiter-equivalents at realistic conversion — not two, and not the six that a naive "reqs per head" number would have suggested.
The TCO stack surfaced what nobody had priced: the company was spending close to $310k/year on contingent agency fees for engineering roles, at roughly 22% of first-year comp. Modeling cost-of-vacancy on revenue-facing sales roles added another layer — each unfilled quota-carrying role was costing an estimated $900–$1,100/day in ramped-pipeline terms.
The reframed proposal: hire three recruiters (one dedicated to engineering), redirect roughly two-thirds of the agency budget internally, and add a sourcing-data tool at ~$28k/year. The net budget increase over the original ask was modest, but the per-hire cost dropped from an implied ~$8,600 to closer to $6,200 at target volume, mostly by pulling engineering hires off agencies.
Finance approved three recruiters plus the tool in one meeting. The number that closed it wasn't the recruiter count — it was showing that the "expensive" ask was actually cheaper per hire than the status quo.
When capacity-backed budgeting is worth it — and when it isn't
When it makes sense:
-
You're scaling and hiring volume varies enough that a flat headcount guess is genuinely risky
-
Finance and TA keep colliding on the budget every cycle
-
A meaningful share of spend sits in agencies, tools, or vacancy cost — not just recruiter comp
-
You have at least rough funnel conversion data to build throughput on
When it's overkill:
-
You hire fewer than roughly 20 people a year and the whole budget is two recruiters and an ATS. The modeling effort will cost more than it saves. A simple per-hire cost estimate is fine.
-
Your funnel data is so unreliable that every input is a guess — fix the analytics foundation first, then model.
Who should be careful: teams that build the model once and never update it. A capacity-backed budget is a living thing. Conversion rates drift, ramp times change, agency mix shifts. A stale model is worse than no model, because it carries false authority. Set a quarterly recalibration and treat the numbers as version-controlled, not carved in stone.
Keeping the model alive without it becoming a second job
The honest tension with all of this is maintenance. A model that lives in a spreadsheet one person built tends to rot the moment that person changes roles or gets busy. Inputs go stale, nobody trusts the outputs, and the next budget cycle reverts to guessing.
Teams that keep it alive treat the underlying data as operational infrastructure, not a quarterly project. Funnel conversion, time-to-fill by role family, recruiter load, and cost-per-hire should flow from the systems you already run rather than getting hand-reconciled every quarter. When your ATS and workflow platform can surface current throughput and cost signals on demand, refreshing the model is an afternoon, not a fire drill — and finance starts trusting it precisely because the numbers reflect what's actually happening, not a snapshot from three quarters ago.
That connection between live operational data and the budget model is what separates a one-time exercise from a durable planning function. The goal isn't a perfect model. It's a defensible one — where every number traces back to a formula, every formula ties to the hiring plan, and every scenario shows finance exactly which lever moves the outcome. Build it that way once, keep the inputs honest, and the annual budget fight stops being a fight. It becomes a calculation both sides can read.
Ready to elevate your hiring process?
Join 1,500+ recruiting teams using Recioly to save time, improve collaboration, and hire smarter.